Format comparison
JPG, PNG, or WebP? Compare three original test images
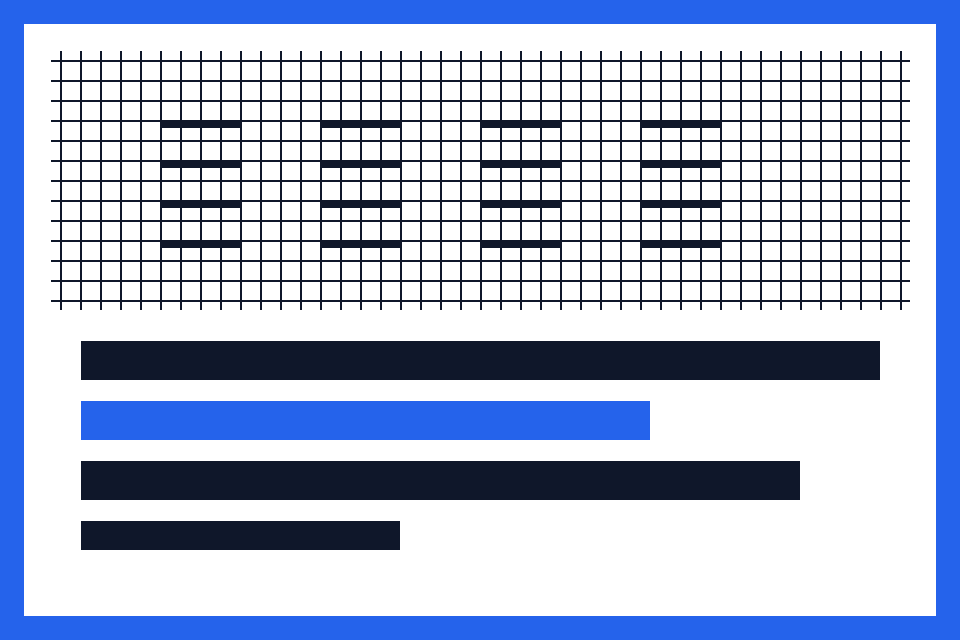
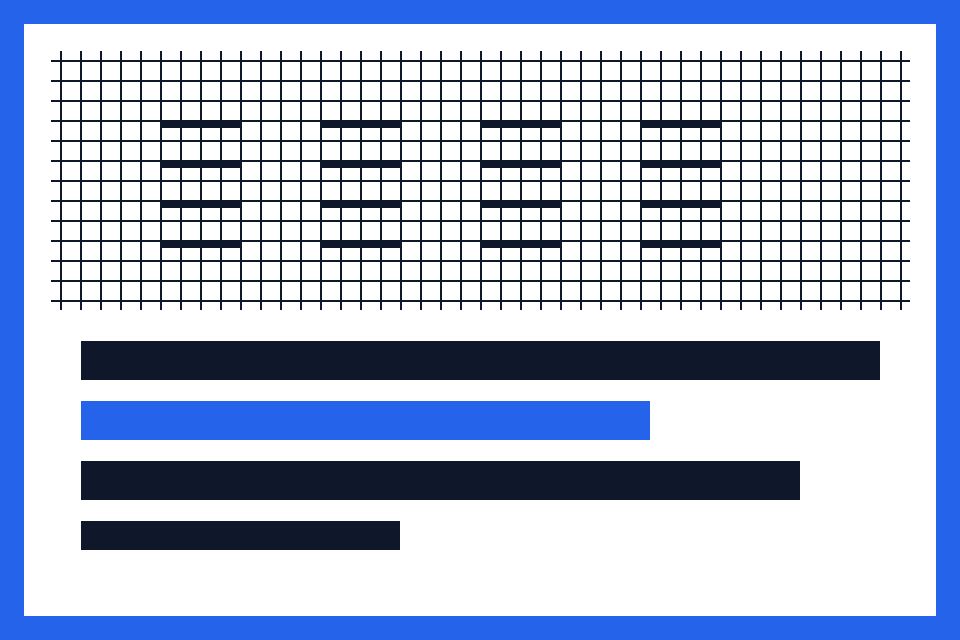
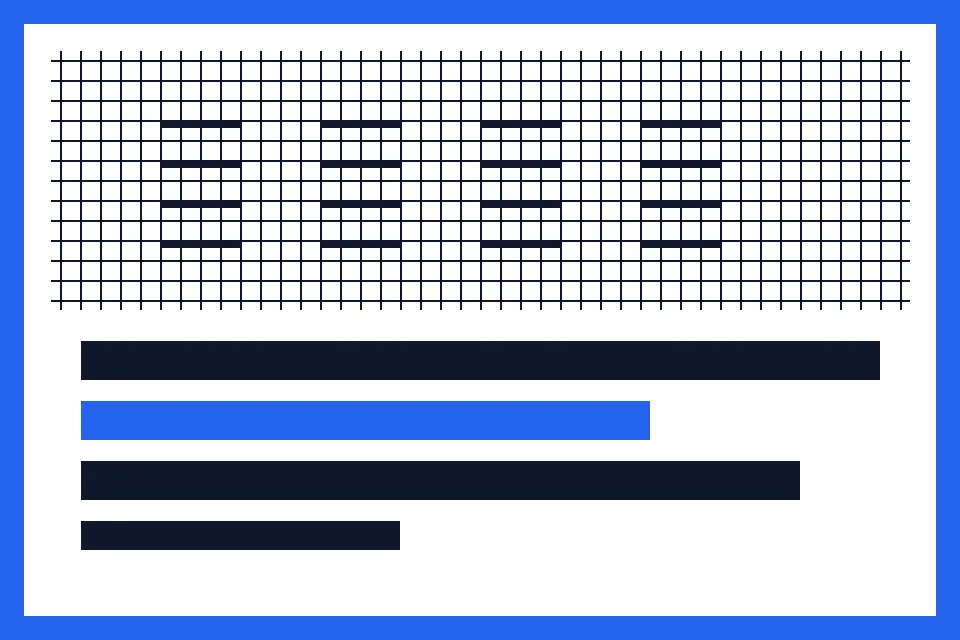
Compare actual byte counts and downloadable examples from Imgkind, with a gradient graphic, sharp line chart, and transparent mark.
A format recommendation becomes more useful when you can inspect the same input in each output format. We created three synthetic test graphics for this article and processed them with the current Imgkind compressor.
The examples isolate gradient detail, sharp edges, and transparency. They are not camera photographs, and the numbers are not a forecast for every upload. Use the original downloads to repeat the experiment on your browser.
Choose by requirement, then inspect the candidate
Start with the destination: an upload form may accept only JPG, whereas your own site can have different choices. Then ask whether transparency and precise edges are part of the image’s purpose.
PNG is a useful candidate for our hard-edged chart. WebP is worth testing for the gradient sample. For the transparent mark, inspect the background as well as byte size. A technically valid file can still be the wrong asset for a layout.
| Image use | First candidate | What to verify |
|---|---|---|
| Upload with restricted formats | An allowed output such as JPG | The form accepts it and fine detail is legible |
| Sharp lines or small labels | PNG, then compare a WebP | Edges at actual display size |
| Transparent graphics | PNG or a compatible WebP | Transparency is retained |
| Your own website illustration | Compare JPEG and WebP | Size, appearance, and destination support |
Inspect the line-chart result at 100%
Download the source PNG and the JPEG output rather than judging a browser thumbnail. Magnify the dark edges against white and look for ringing or block-shaped changes. A preview scaled to fit this article may conceal differences.
Treat transparent output as a separate requirement
JPEG output from the compressor uses a white fill. It cannot serve as an interchangeable transparent version of the mark. Place the PNG and JPEG on a colored slide to see the practical difference.
The converter and compressor use different encoding paths and settings. These measurements describe the Canvas compressor shown in the method, not every tool on this website.
Original experiment: files and measurements
Measured on 12 October 2026 in the Codex in-app browser on macOS, using the Imgkind Canvas compressor. Inputs are our synthetic PNG graphics. Dimensions were unchanged; JPEG and WebP used quality 80. PNG ignores that quality setting. Values below are exact bytes; the tool’s KB display uses 1024 bytes per KB.
| Sample | Original PNG | JPEG · 80 | WebP · 80 | PNG |
|---|---|---|---|---|
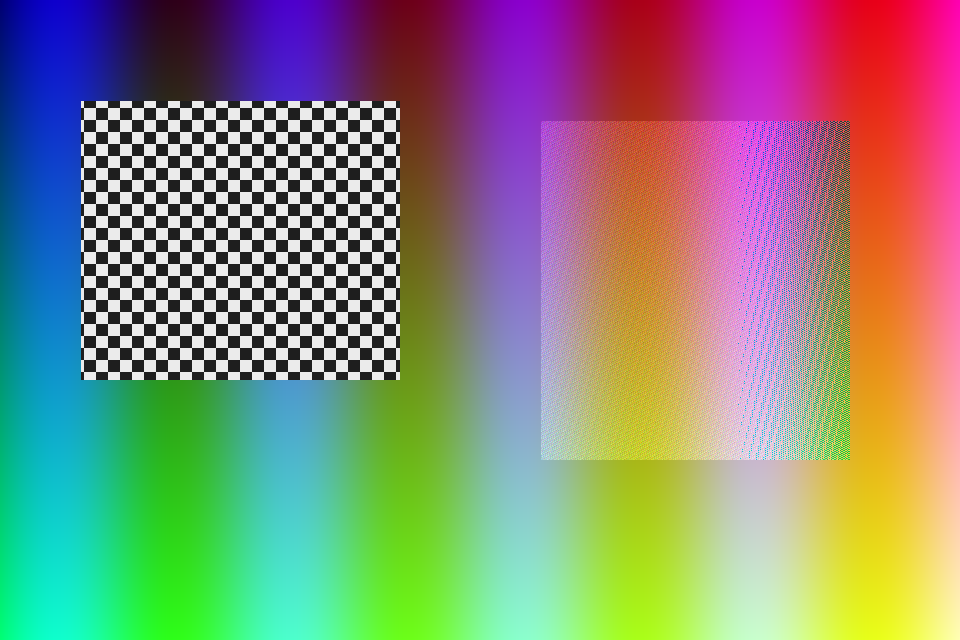
| Gradient and detail grid960 × 640 px | 706,133 B | 61,795 B | 44,200 B | 138,496 B |
| Sharp line chart960 × 640 px | 7,864 B | 56,394 B | 11,650 B | 16,959 B |
| Transparent mark512 × 512 px | 12,078 B | 7,872 B | 7,404 B | 23,522 B |
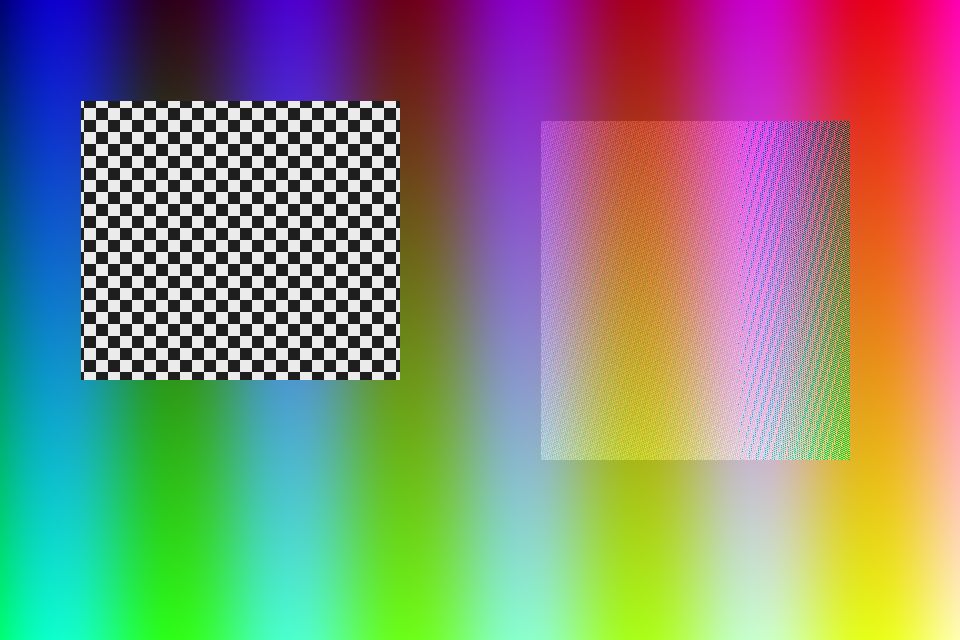
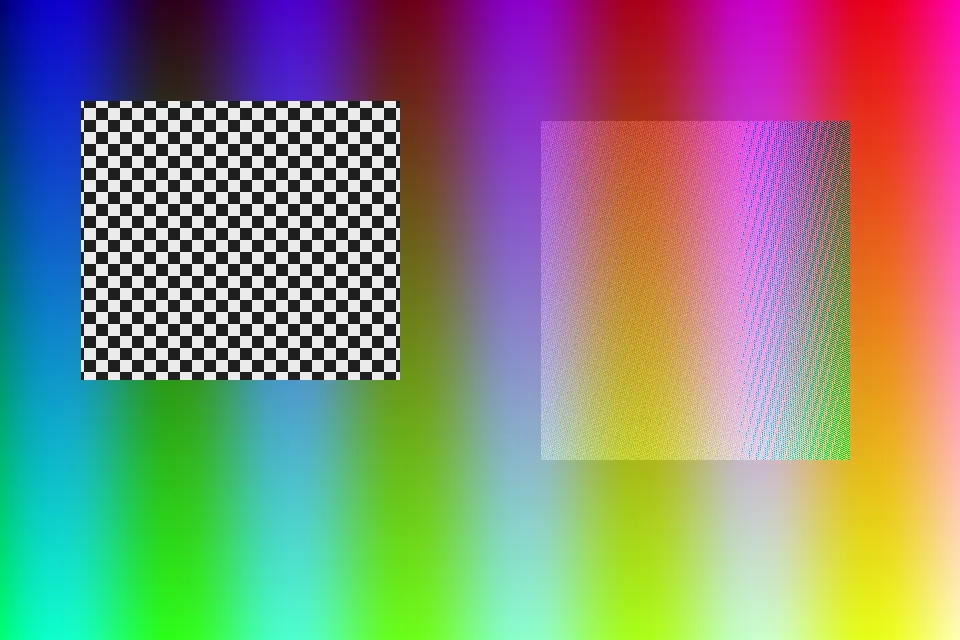
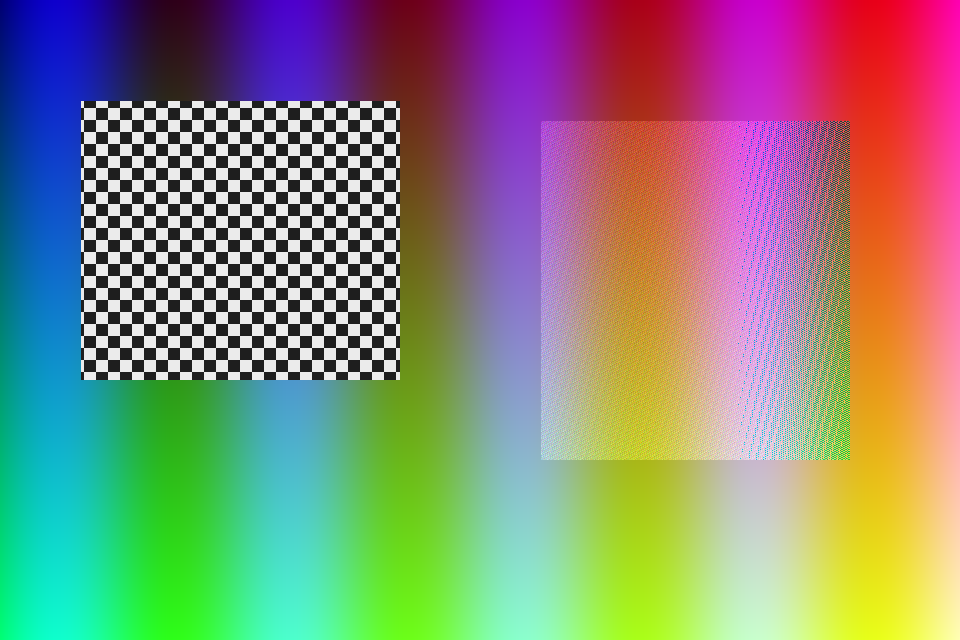
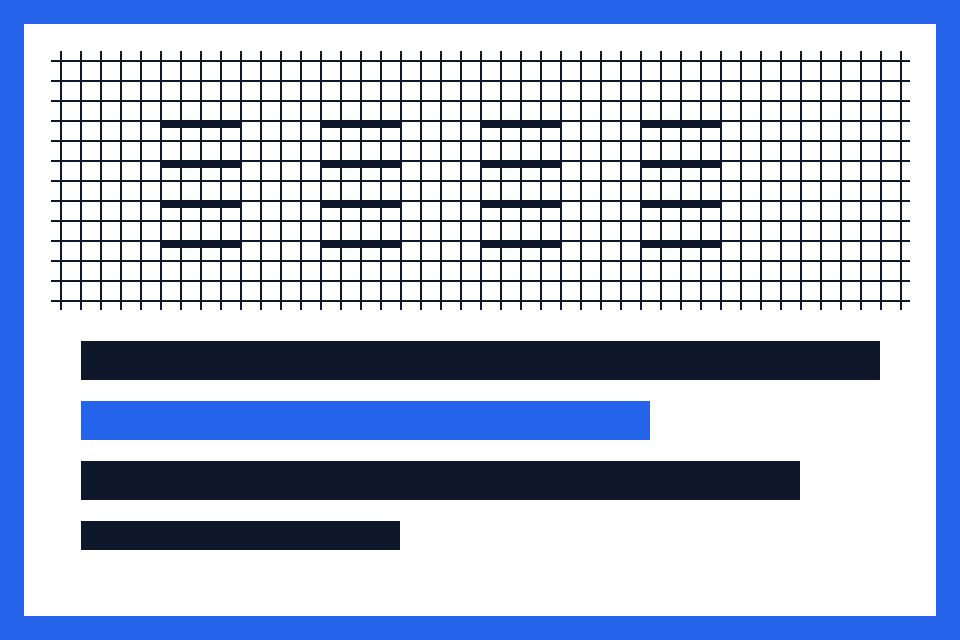



These three samples do not represent all photos or documents. A matching quality number does not imply equal visual quality. JPEG fills transparency with white; this changes the asset. Different browsers may produce different bytes. Reproduce the experiment using the included originals and source generator.

Steps
- Download the three original samples or the complete experiment ZIP.
- Select them in Image Compressor and set JPEG quality to 80. Process and inspect individual byte sizes.
- Repeat from the original samples with WebP quality 80 and PNG output.
- Open the outputs at 100% zoom and compare edges and transparent regions.
- Choose a candidate according to the real destination, then repeat with your own image.
Helpful tips
- A quality value of 80 in two encoders does not establish equal perceptual quality.
- The PNG source and PNG re-encoding can use different compression choices.
- Keep the sample dimensions unchanged for a fair comparison of this experiment.
Frequently asked questions
Is WebP always the smallest?
No. The line-chart input in this experiment is smaller as its original PNG than either tested lossy output.
Are these real photographs?
No. They are deterministic synthetic graphics made by Imgkind, with source generation code and files provided.
Can I reuse the sample graphics?
Yes. The graphics and measured outputs in this experiment were created for Imgkind and are provided for your own testing.